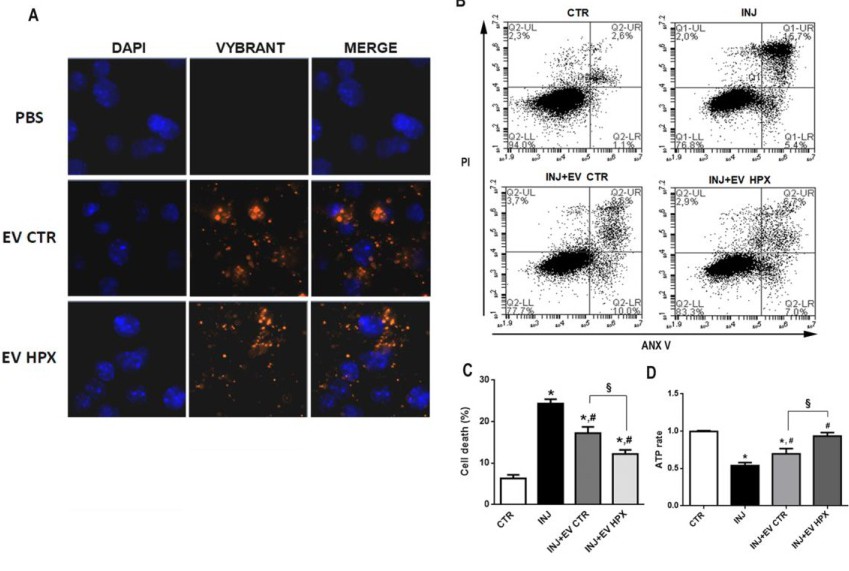
Fig. 2. EV CTR and EV HPX uptake by RPTECs and their protective effect after ATP depletion injury in an in vitro model. Representative fluorescent images of RPTECs incubated for 24 h after injury with EV CTR or EV HPX previously stained with Vybrant DiI (red fluorescence). Renal cell nuclei were stained with DAPI (blue fluorescence). PBS condition indicates the staining protocol in the absence of vesicles in order to exclude the non-specific signal given by Vybrant DiI aggregates (A). Flow cytometry analyses of renal cells marked for ANX V/PI under the different experimental conditions: CTR (cells not ATP depleted), INJ (cells submitted to ATP depletion), INJ+EV CTR (cells ATP depleted followed by 24 h incubation with EV CTR) and INJ+EV HPX (cells ATP depleted followed by 24 h incubation with EV HPX) (B). Quantification of flow cytometry analysis to determine the rate of cell death of renal cells in all groups (n = 6) (C). Levels of intracellular ATP (ATP rate with respect to SHAM) of renal tubule cells under the 4 experimental conditions (n = 7) (D). Data represent mean ± SEM. (* indicates statistical difference to SHAM group; # indicates statistical difference to IRI group, § indicates statistical difference to IRI+EV CTR group, P<0.05 assessed by one-way ANOVA followed by Tukey's test). Abbreviations: RPTECs: renal tubule epithelial cells; EV extracellular vesicles; CTR, control; HPX, hypoxia; INJ, injury; PI, propidium iodide; ANX V, annexin V, DAPI, 4',6-Diamidino-2-Phenylindole; PBS, phosphate buffered saline.